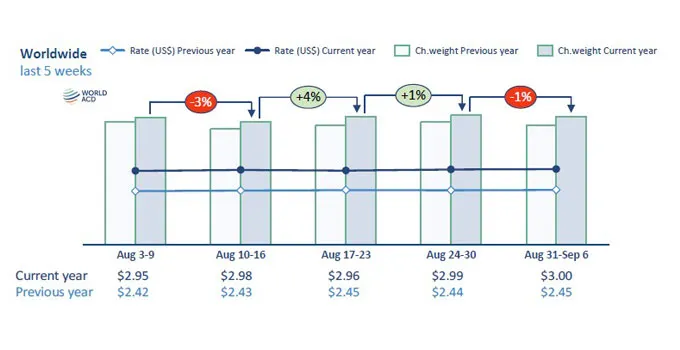
Global air cargo volumes slipped -1% week on week (WoW) in week 36, as hostilities in the Middle East flared up again and exports from Southeast Asia were affected by national holidays in the region.
Pricing barely changed, held high by a small decrease in capacity, with rising oil prices bringing upward pressure on fuel surcharges ahead.
The latest figures from WorldACD show that chargeable weight declined WoW out of three regions in week 36 (August 31 to September 6) from the previous week, led by a -4% drop from Central & South America (CSA), while volumes out of North America and Asia Pacific contracted -3% and -1% respectively. Traffic from Europe and the Middle East & South Asia (MESA) was flat, leaving Africa the only origin to show mild growth (1%).
Global traffic up
Compared to the same week in 2025, global traffic was 7% higher, with increased tonnage out of all regions. Chargeable weight out of North America was 18% higher year on year (YoY), while volumes from all other regions rose in single digit percentages. The surge from North America can be partly explained by the US and Canada Labour Day which was in week 36 in 2025 but in week 37 this year.
WoW developments diverged from the trend of the past weeks, with a 3% increase in global tonnage, driven by 6% growth out of Asia Pacific and Africa and low single-digit gains from North America and CSA, whereas chargeable weight contracted out of Europe (-2%) and MESA (-1%).
Traffic was up 2Wo2W on all sectors from Asia Pacific, while North America registered expansion to Europe (5%) and CSA (4%). Volumes from Europe, on the other hand, declined in all sectors, slipping -1% to North America and CSA, -3% to Asia Pacific and Africa and -4% to MESA.
Hostilities and holidays hold volumes in check
The resumption of hostilities in the Persian Gulf affected traffic to and from the MESA region, resulting in flat volumes WoW both to Europe and US. Chargeable weight from Dubai declined -19% to US, while tonnage out of India was flat to US and up 1% to Europe.
Year on year tonnage from the MESA region to US was up 25%, driven by increases from India (42%) and Bangladesh (21%), and partly reflecting US Labour Day being earlier last year. Chargeable weight to Europe fell -6% due to contraction out of Dubai (-61%) and Bangladesh (-5%).
Traffic out of Asia Pacific sank -3% WoW to US while tonnage to Europe was unchanged. One factor were national holidays in Vietnam (National Independence Day celebrations from August 29 to September 2) and Malaysia (National Day on September 1). To US the largest drops in chargeable weight occurred in Vietnam (-23%), followed by Malaysia and Singapore (-11% each). Malaysia (-27%) and Vietnam (-24%) led WoW tonnage declines to Europe.
Slow China improvement
Of the Asia Pacific origins that boosted traffic to Europe, Hong Kong led the charge with a 6% WoW increase, which marked a third consecutive week of rising volume, ending a stretch of WoW tonnage declines from mid-June except for a 1% improvement in week 21 (June 15 to 21). The slump can be largely attributed to the impact of the European Union’s move to curb e-commerce imports. Despite the recent improvements, Hong Kong to Europe tonnage was still down -26% YoY, a far larger contraction than annual declines from other Asia Pacific origins.
Tonnage out of China, which had also been affected by the EU move on e-commerce imports, returned to WoW expansion in week 32 (August 3 – 9), growing since then in low single-digit percentages to end up -5% YoY in week 36.
Capacity remains steady
The slump in e-commerce to Europe prompted a quick re-allocation of freighter capacity from Asia Pacific-Europe to transpacific sectors. Week 36 saw capacity retreat -1% WoW in Asia Pacific and North America, though, while lift from CSA dropped -3%. Capacity rose 1% out of Africa and MESA (despite a -2% decline out of the Gulf region) and was flat in Europe.
Sinking -1% worldwide, capacity development continued the pattern seen since week 26 (June 22 to 28) of WoW fluctuations within 1% and -1%, an indication that output of new widebody aircraft remains hobbled by supply chain problems at the manufacturers. The relatively stable situation, combined with re-deployment of freighters from slower to more active markets, has been a contributing factor to relative pricing stability, which continued in the past week.
Pricing flat but poised to rise
Rates were essentially flat WoW, inching up from a global average of $2.99 the previous week to $3.00. It was unchanged out of Africa, Europe and MESA, rose 1% from Asia Pacific and CSA while sinking -2% from North America. 2Wo2W worldwide pricing was up 1%, driven by increases from MESA (3%) and CSA (1%).
WoW spot rates out of Asia Pacific rose 2% to US and 3% to Europe. Rates to Europe climbed out of most Asia Pacific origins, led by Taiwan (7%), followed by China and Thailand (6%). For the most part, pricing from the region to US shows single-digit increases except from South Korea, Vietnam and Singapore, where rates declined. YoY pricing to Europe was 15% higher, while rates to US were 40% higher than a year ago.
Overall pricing from MESA to US dropped -2% WoW, despite increases out of Sri Lanka and Dubai, but the average rate was still almost 60% higher than a year ago. To Europe low single-digit increases from Dubai and India cancelled out lower rates out of Bangladesh and Sri Lanka, which kept the average rate to Europe unchanged from the previous week.
However, the resumption of the conflict between Iran and the US has driven up the oil price above the $100-per-barrel threshold, pointing to higher aviation fuel costs and surcharges ahead.—TradeArabia News Service